

Home · Resources · Publications
Interpretation of Airborne Geophysical Data for Geological Mapping of the Crystalline Basement
| Author(s): P. S. Babayants, Yu. I. Blokh, V. A. Bush, M. V. Mints, A. A. Trusov, I. B. Filippova |
Aeromagnetic and airborne gravity data play a crucial role in geological mapping and studies of deep subsurface structure. Their rapid interpretation provides new information revealing the internal structure and formation history of the crystalline basement, furnishing a modern basis for regional geological studies and metallogenic prediction.
The first stage of interpretation examines the topography of the crystalline basement surface. This is usually based on seismic data (primarily the most reliable common-depth-point reflection seismic data) and deep drilling, sometimes supplemented by information from deep electrical soundings. Nevertheless, the total number of locations with reasonably reliable basement-depth information generally remains very limited, and their spatial distribution is extremely uneven. Formal interpolation clearly yields highly unreliable results in these circumstances, and the resulting gaps are often filled using correlations between basement topography and the regional gravity field. However, basement-surface morphology only partly determines the gravity field. Compositional heterogeneities within the basement and sedimentary-cover formations also contribute substantially to its structure, naturally introducing errors into the resulting maps. Consequently, where different researchers have compiled structural maps of the crystalline basement surface, their basement elevations generally differ by hundreds of metres, and the overall structural pattern often differs markedly as well.
Mapping of the crystalline basement surface can be considerably improved by incorporating additional aeromagnetic information. Most of the anomalous magnetic-field energy (up to 99%) is often attributable specifically to the upper crystalline basement, and in most platform regions magnetic surveying is effectively a direct method for mapping it. The problem lies only in developing effective ways to extract the required information, an endeavour that has attracted considerable effort over a long period. One of the most powerful currently available tools is the ROMGAS technology, implemented in the program of the same name, which consolidates previous advances in this field. It determines the coordinates of singular points of the functions describing magnetic anomalies from the amplitude spectrum calculated in a moving window [1]. It is used to map the so-called Main Magnetically Active Surface (MMAS), the upper envelope of the set of singular points. Although natural geological factors may place the MMAS above or below the basement surface in individual areas, throughout the sediment-covered parts of platforms it predominantly coincides with that boundary. ROMGAS has now been used to investigate crystalline basement topography over approximately 25% of the Russian Federation. Most of this territory was previously covered by State aeromagnetic surveys at 1:200,000 scale, and the relative accuracy of MMAS determination from these data is usually no worse than 10%. Under favourable conditions, modern detailed aeromagnetic data provide substantially higher accuracy.
Fig. 1 shows a cross-plot comparing drilling data from 394 wells within the Moscow Syneclise with ROMGAS results. The analysis shows that this technology produces reliable results throughout the area except where aulacogens occur, using data that, across most of the territory, derive from State aeromagnetic surveys conducted in the middle of the last century. In these areas, the upper singularities within the 50×50 km moving window used to map the MMAS lie on the flanks and therefore do not reflect the true depth to the aulacogen floor. Nevertheless, the overall root-mean-square error in determining crystalline basement-surface depths within the Moscow Syneclise was 267.5 m, and the correlation coefficient between drilling-derived and ROMGAS depths was 0.940.
The second interpretation stage involves integrated modelling of the crystalline basement using REIST from the SIGMA-3D package, designed to construct a subhorizontal layer model with laterally varying magnetization and density [2]. The upper model boundary is a contact surface coinciding with the basement top, while the lower boundary is assumed horizontal at a depth determined by spectral analysis of the fields. The layer is divided into prisms with square plan sections, their dimensions selected according to the survey scale and mean depths to the upper boundary. An iterative method uses the observed fields to determine the density and magnetization contrasts of each prism relative to one chosen as a reference. Rock magnetization is assumed predominantly induced and aligned with the present-day field. REIST uniquely determines, as follows from V. M. Novoselitsky’s theorem [5], effective densities and magnetizations of the approximating elements whose fields match the observations as closely as possible. Effective petrophysical values can be converted to true values by comparison with borehole core measurements.
The technology implemented in REIST offers interpreters the following principal capabilities:
- improving geological mapping from gravity and magnetic data by shifting from analysis of observed fields to analysis of effective physical-property distributions;
- simplifying and standardizing geological interpretation of magnetic anomalies DT by eliminating differences arising from variations in geomagnetic-field direction between regions of the Earth and the associated direction of rock magnetization;
- removing complicating local magnetic anomalies of induced origin that are unrelated to geological structure, and facilitating detection of weak local anomalies at their locations;
- identifying local bodies with strong natural remanent magnetization whose direction differs from the present-day geomagnetic field: on the resulting magnetization-distribution map, such bodies are accompanied by an opposite-sign magnetization anomaly on the side towards which the horizontal projection of the magnetization vector points;
detecting local bodies whose upper or lower edges lie at depths significantly different from those specified for the whole layer: such a body will lack sharp boundaries on the resulting map if it lies deeper than specified, or will be surrounded by an anomalous zone of opposite-sign magnetization or density if it lies shallower than specified.
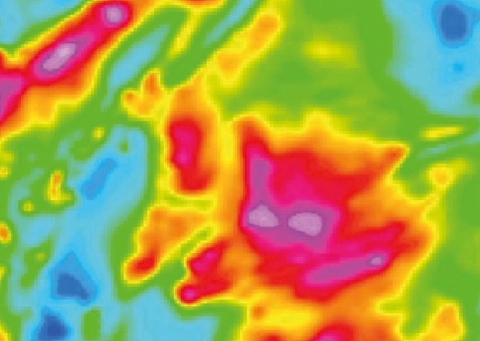
The effectiveness of converting the magnetic field into a model of effective magnetization distribution is illustrated in Fig. 2 for an area within the Moscow Syneclise. It shows how REIST modelling emphasizes the geological information contained in the anomalous field and reveals important structural details.
Fig. 2. Part of a model of effective magnetization distribution in the crystalline basement of the Moscow Syneclise: а) anomalous field DT; б) distribution of effective basement-rock magnetization obtained using REIST
The third interpretation stage involves integrated classification of the crystalline basement rock density and magnetization maps constructed with REIST at the preceding stage. CLASS2 from the SIGMA-3D package is used to interactively divide the two-dimensional histogram of density/magnetization combinations into statistically homogeneous petrophysical complexes (PCs) [3]. Homogeneity is defined by individual clusters of these two parameters, and map areas belonging to a class are immediately displayed and assigned conventional colours. Once a class is delineated, the program calculates statistical characteristics for each parameter. The interpreted area is thus interactively divided into a set of statistically homogeneous PCs.
Fig. 3 presents classification results for effective rock density and magnetization in Karelia, along a segment of geotraverse 1-EV. The area is relatively well exposed and can serve as a reference in terms of geological and petrophysical knowledge. Figs. 3а and 3б show the original anomalous fields Dg and DT, while Figs. 3в and 3г show effective density and magnetization maps obtained by automatic modelling of the original fields in REIST. A modified two-dimensional histogram of effective density and magnetization, with class boundaries interactively delineated in CLASS2, is shown in Fig. 3ж. In Fig. 3з, the classes are assigned different colours according to their presumed petrophysical equivalents, effectively forming the classification-map legend. The spatial distribution of the classes is shown in Fig. 3д. All these figures are generated by CLASS2 itself. Comparison of the two-parameter classification results with the geological map in Fig. 3е shows that these technologies have produced appropriate results here.
maps of the gravity field (а), magnetic field DT (б), and effective density (в) and magnetization (г) from REIST modelling; class map from interactive CLASS2 processing (д); fragment of the geological map (е); two-dimensional histogram of effective density and magnetization with delineated class boundaries (ж); classification-map legend (з)
The internal structure of the identified PCs is established by principal-component filtering of the density and magnetization distribution matrices using MGK. Local components of the petrophysical models mark the spatial distribution of petrographically distinct rocks within a statistically unified PC. These maps reveal step-type anomalies, linear anomalies associated with dykes, bed strikes, zones of alteration along faults, zones of disrupted correlation and changes in their characteristic features, often coinciding with strike-slip faults. This technology deciphers the internal structure of PCs, identifies folds and faults, small igneous bodies and zones of rock alteration, enriches geological maps with specific structural information, and enables delineation of structural–compositional complexes (SCCs). These are characterized both by stable petrophysical properties and by distinctive combinations of fold, fault and igneous structures.
One area of basement research that particularly benefits from maps of the principal components of effective physical properties and of the differences between the corresponding property values and these components is mapping zones of tectonic reactivation. Recognition of the faults controlling these zones involves several stages. First, each component is examined separately and a fault map is compiled. After assessing the map data quality, the interpreter delineates all reliable anomalies of the types of interest. The second stage synthesizes the morphological analysis of each map and compiles summary fault maps independently from magnetic and gravity data. This stage establishes the consistency of fault identification. A fault is considered most reliable when independently detected on maps of different components. Finally, the third stage synthesizes the magnetic and gravity results into an integrated interpretation. The final map is compiled at this stage, and the interpreter can assess the reliability of faults identified at preceding stages.
Fig. 4 illustrates application of this technology to an area within the Moscow Syneclise. Figs. 4а and 4б show the same lines of probable faults: black lines were recognized on maps of different effective magnetization components, and white lines on effective density maps. Most lines initially detected on magnetization maps can be confidently traced on density maps, and vice versa. Some faults, however, are detected by only one method. Overall, comparison of these figures indicates that such mapping is fairly robust and highly effective in detecting basement faults. Naturally, the original magnetic data in this example are at a larger scale, so substantially more lines were initially delineated from them.
The final stage of geophysical interpretation determines the volumetric distribution of effective parameters using DVOP, establishing spatial relationships between SCCs. Both approximation and filtering approaches can be implemented to construct three-dimensional models of rock physical-property distributions [3]. These models can be dynamically visualized along arbitrary networks of sections and horizontal slices. The technology identifies inclined PC contacts associated with thrusts and vertical contacts associated with strike-slip faults, maps tectonic allochthons, and identifies buried granite intrusions and other structures. Dip directions of contacts between SCCs are generally corroborated by common-depth-point seismic reflection results.
At the concluding stage, the results are interpreted geologically, and PC maps are transformed into structural–compositional complex (SCC) maps by correlation with deep wells penetrating the basement and geological data from adjacent exposed or well-drilled areas. These data constrain the actual petrographic composition, metamorphic grade and absolute age of the identified SCCs. Geological analysis of PC classification maps shows that, in some cases, one SCC may correspond to two or three PC classes, or one PC may combine different SCCs with similar petrographic properties. In such cases, the classification diagram is used to subdivide a class into two or more, or to merge adjacent classes, with the result checked by redisplaying the new SCCs on the map.
Maps of local effective magnetization components provide particularly abundant information for deciphering the internal structure of SCCs. They reveal rock strike directions within SCCs and major folds, identify rounded granite-gneiss and migmatite domes from circular or oval anomaly patterns and large granitoid massifs from broad “structureless” areas, and establish tectonic unconformities between different SCCs or the cross-cutting nature of igneous contacts.
The methodology described has been applied, in particular, to geological maps of the Precambrian basement of the East European Platform at various scales. As an example, Fig. 5 compares our SCC map of the Precambrian basement of sheet N-37 (Moscow) with the basement map illustrating the “Explanatory Note to the State Geological Map at 1:1,000,000 Scale”, published in 1999.
The Archean structures of the Volga–Ural Arch in the eastern part of this territory were subdivided into the granulite–mafic SCC of the Otradnaya Series and the “felsic” granulite SCC of the Bolshecheremshan Series. Systems of tectonic nappes were identified, resulting from thrusting of Archean structures over the Early Proterozoic structures of the Toropets–Serdobsk Belt. The northeastern part of the territory contains the Moscow block of felsic granulites, belonging to the Early Proterozoic Moscow–Mezen Belt. Early Proterozoic mafic intrusions and zones of granitization and migmatization were identified here.
The central part of the territory is occupied by the Toropets–Serdobsk Belt, a collision zone between the Volga–Ural and Sarmatian Archean protocontinents. Its internal structure beneath the thick sedimentary succession of the Pachelma Aulacogen was established for the first time. It consists of large northeast-dipping tectonic sheets separated by thrust surfaces. The southern sheet comprises the greenstone–schist successions of the Kaluga Zone, representing an accretionary prism. The second sheet is the Peresypkino granulite block, marking an Early Proterozoic subduction zone. The third, Serpukhov Zone of the Toropets–Serdobsk Belt, comprises Late Archean(?)–Early Proterozoic greenstone volcanogenic–terrigenous successions metamorphosed in amphibolite facies and forming a fan-shaped fold-and-nappe system. These formations resemble supra-subduction palaeo-island-arc assemblages. In the southeast, structures of the Serpukhov Zone and Peresypkino block are strongly migmatized along northwest-striking post-collisional sinistral strike-slip faults.
The Toropets–Serdobsk Belt as a whole is thrust southwestward and sharply truncates, with discordance, the underlying structures of the Sarmatian Archean protocontinent along the northern margin of the Voronezh Massif. Sheet N-37 includes the eastern part of the Early Proterozoic Kursk iron-ore belt, where Archean formations—the migmatite–gneiss Oboyan Series and metavolcanic greenstone Mikhailovka Series—are distinguished, together with the Lower Proterozoic Kursk iron-ore and Oskol series. A complex S-shaped thrust–strike-slip structure of the Kursk Belt was established, and numerous gneiss domes and intrusions of the Late Archean Saltykovka granitoid complex were identified. Farther east lies the Lipetsk–Losevo volcanic belt, marking the Early Proterozoic active margin of the protocontinent. It contains identified exposures of Archean Oboyan Series substrate, Early Proterozoic gneiss domes, and mafic and felsic igneous intrusions. The easternmost Vorontsovka Zone consists of Lower Proterozoic metaterrigenous sediments with mafic and felsic intrusions. It is separated from the Losevo Zone by the Livny suture, a former subduction zone.
Maps derived from airborne geophysical interpretation can, in turn, provide a basis for tracing the identified complexes to depth using deep seismic sounding data, resulting in three-dimensional models of the deep structure of the crust.
Thus, interpretation of modern airborne geophysical survey data provides new information on crystalline basement structure. The resulting petrophysical basement models can furnish a modern basis for regional geological studies and metallogenic prediction. Subtracting model fields from observed fields yields residual anomalies associated with geological formations in the upper part of the study-area section that are prospective for mineral exploration. Dedicated articles in this journal address these issues.
REFERENCES
1. Babayants P. S., Blokh Yu. I., Trusov A. A. Investigation of crystalline basement-surface topography using magnetic data. Geofizika. 2003. No. 4. pp. 37–40.
2. Babayants P. S., Blokh Yu. I., Trusov A. A. Investigation of crystalline basement structure in platform regions using magnetic and gravity data. Geofizika. 2003. No. 6. pp. 55–58.
3. Babayants P. S., Blokh Yu. I., Trusov A. A. Interpretive tomography using gravity and magnetic data in the SIGMA-3D software package. Problems of Theory and Practice in Geological Interpretation of Gravity, Magnetic and Electrical Fields: Proceedings of the 31st Session of the D. G. Uspensky International Seminar. Moscow: OIFZ RAS. 2004. p. 11.
4. Babayants P. S., Blokh Yu. I., Trusov A. A. Capabilities for structural–compositional mapping using magnetic and gravity data in the SIGMA-3D software package. Geofizicheskii Vestnik. 2004. No. 3. pp. 11–15.
5. Novoselitsky V. M. On the theory of determining density variations in a horizontal layer from gravity anomalies. Izvestiya AN SSSR. Fizika Zemli. 1965. No. 5. pp. 25–32.