

Home · Resources · Publications
Interpretation of Airborne Geophysical Data in Oil and Gas Exploration
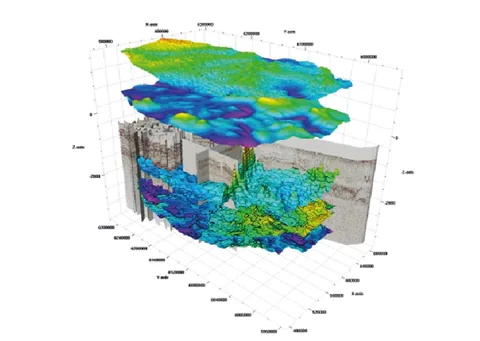
| Author(s): P. S. Babayants, Yu. I. Blokh, V. A. Bush, M. V. Mints, A. A. Trusov, I. B. Filippova |
The structural method, implemented mainly through seismic surveying, currently leads oil and gas exploration. In many regions, however, exploration based exclusively on structural criteria has limited effectiveness. There is an urgent need to broaden the exploration toolkit and introduce methods based on entirely different physical and geological principles. In this respect, inexpensive and mobile airborne geophysical technologies appear particularly promising, both in regions explored for many decades and especially where exploration is only beginning. One particularly promising direction is exploration of extensive shallow-water transition zones of the continental shelf, which remain very poorly studied in the Russian Federation but have hydrocarbon potential.
The suite of airborne geophysical methods for oil and gas exploration is now well established. It usually includes aeromagnetic surveying, airborne gamma-ray spectrometry, and airborne gas surveying to determine methane and propane concentrations in the near-surface atmosphere. Airborne gravity surveying has increasingly been included in recent years, owing to a sharp improvement in data quality resulting from modern hardware and software developments. Airborne gravity surveys now provide Bouguer anomaly fields with a root-mean-square error of 0.5 mGal when conducted from a fixed-wing aircraft, and their data quality and spatial resolution meet the requirements for ground surveys at 1:100,000 scale.
At GNPP Aerogeofizika, areas prospective for oil and gas are investigated using a dedicated technology for substantive geological interpretation of integrated airborne geophysical data, developed specifically for hydrocarbon exploration. It addresses several geological tasks, the first concerning basement geology. This task has two aspects. On the one hand, knowledge of basement geology helps explain the formation of the sedimentary cover and the distribution patterns of its hydrocarbon deposits. The topography of geological boundaries in the sedimentary cover may inherit that of the basement surface. On the other hand, the discovery of several dozen large and exceptional hydrocarbon fields in upper crystalline basement rocks, including Bach Ho (White Tiger) in Vietnam, has demonstrated real prospects for oil and gas exploration within the basement itself.
Magnetic prospecting is the principal method for this task, because the main sources of the anomalous magnetic field in platform regions are associated with crystalline basement rocks. In such regions, aeromagnetic surveying is effectively a direct method for investigating basement structure, efficiently implemented through the technologies developed. A complete and comprehensive solution, however, requires gravity data, including rapidly developing airborne gravimetry. As this issue of the journal contains a separate article on basement structure, there is no need to describe these technologies again.
Another group of tasks addressed by airborne geophysical methods in hydrocarbon exploration involves isolating anomalies from geological formations in the sedimentary cover and interpreting them quantitatively. Aeromagnetic surveying is also highly informative here, and separation of basement and sedimentary-cover fields is the most important interpretation procedure. In general, this problem has no rigorous solution owing to well-known theoretical constraints [6]. One can therefore only attempt to separate the original field into two components, one predominantly containing the part associated with the deep basement. The other would then retain a component whose energy is mostly associated with shallow bodies. The criterion of minimum introduced distortion, or equivalently the fidelity of the separated components, is paramount.
The traditional approach to separating basement and sedimentary-cover fields uses various transformations by filtering (frequency selection) in moving windows; in our opinion, however, this is a dead end. Any transformation, however appealing its results may be to the interpreter, inevitably introduces fundamental distortions into the separated components, converting the original function into an entirely different class. The transform is effectively the field of a completely different mass distribution, whose redistribution law can be complex and may be summarized as follows. Each point mass of the bodies under study is redistributed in proportion to the transformation weights within a horizontal area shaped like the moving transformation window and centred on the mass location [1]. In practice, transformations therefore prevent further quantitative interpretation of the separated components. These components can only characterize possible sources qualitatively, and not always reliably: every transformation inevitably produces numerous additional (often termed spurious) local extrema unrelated to geological causes and determined solely by the redistribution law. Moreover, all field transformations are performed without accounting for the actual elevations of the locations where field elements were measured, making quantitative interpretation of their results not merely meaningless but, one might say, objectionable.
The approach we implement with the SIGMA-3D programs avoids the fundamental drawbacks of transformations. Separation generally requires only subtraction, from the original anomalous field, of the field of a subhorizontal layer model approximating the basement, constructed using ROMGAS and REIST. This is termed geological removal of the basement contribution; the modelling workflow is described in a separate article in this journal. This technology likewise cannot, in principle, overcome the theoretical non-uniqueness, in the general case, of separating fields from sources at different depths in the basement and sedimentary cover. Nevertheless, it is readily demonstrated that this approach is much better justified in terms of the fidelity of its components to the fields of the separated sources.
Undoubtedly, the subhorizontal layer model constructed by REIST contains errors that will also appear in the residual anomalies after its field is subtracted from the observations. Among the many causes, two are principal:
1. Errors in the a priori data supplied to REIST, particularly the depths of the upper and lower boundaries of the modelled subhorizontal layer;
2. Errors associated with the model’s characteristics: its discrete nature, vertical boundaries between elements (approximation errors), collinearity of the magnetization vectors in all elements, neglect of demagnetization in the body’s own anomalous field, and so forth [2].
Nevertheless, these errors do not introduce interference into the residual fields as fundamental or substantial as that caused by transformations. Although some basement influence remains because of these errors, it is extremely attenuated. This attenuation is the maximum possible for the model used, since during fitting REIST automatically removes everything in the original field that can be explained by elements of the basement approximation [2]. At the same time, source fields whose anomaly-function singularities lie in the sedimentary cover, outside the subhorizontal basement layer, undergo no distortion at all. No singularity associated with sources above the subhorizontal layer model changes its position or type. No additional local extrema of the kind inevitably produced by transformations appear, and so forth. The residual fields obtained using REIST from the SIGMA-3D package are therefore minimally distorted fields of sedimentary-cover sources and can undergo further interpretation, including quantitative interpretation.
To illustrate the effectiveness of this approach, consider the isolation of magnetic anomalies from sedimentary-cover sources in an area of the Yamalo-Nenets Autonomous Okrug, Western Siberia. In Fig. 1, the residual magnetic field after removal of the Palaeozoic basement model contribution is compared with a seismic-derived map of reflection horizon Б. The residual anomalies have a relatively small amplitude of approximately 5 nT. Nevertheless, they are entirely reliable for modern aeromagnetic surveys using caesium magnetometers with a sensitivity threshold no greater than 0.001 nT. The map also clearly shows interfering linear anomalies from anthropogenic sources: roads, power lines, pipelines, and so on. The observed ΔT field in this region is mainly associated with Palaeozoic rocks and has anomaly amplitudes of approximately 500 nT, yet the technology described reliably isolates weak sedimentary-cover anomalies against this background. Fig. 1 shows that the strongest local residual magnetic maxima coincide with antiforms identified by seismic surveying. In this area, these antiforms correspond to large gas and gas-condensate fields. The local anomalies apparently arise from sedimentary rocks whose magnetization has been altered by migrating hydrocarbons.
Secondary alteration of sedimentary rocks by hydrocarbons, and the potential for exploring deposits through its study, have been discussed by geologists, geophysicists and geochemists for a century. As early as 1908, G. Harris found pyrite and other sulphides in rocks overlying oil accumulations associated with Louisiana salt domes. In 1922, F. Reeves, studying the Cement oil field in Oklahoma, found that hydrocarbons could change sedimentary-rock colour, particularly from red to grey. Cement subsequently became a natural laboratory continually studied by petroleum specialists of different disciplines. In the 1970s, shortly after high-precision quantum magnetometers appeared, magnetic exploration specialists joined these investigations. By 1979, T. Donovan and colleagues had established that secondary alteration of sedimentary rocks by migrating hydrocarbons could significantly change their magnetization, creating local magnetic anomalies that could be deliberately sought by aeromagnetic surveying [8]. Donovan’s series of articles encouraged geophysicists worldwide to use aeromagnetic surveys in oil and gas exploration. In our country, V. M. Berezkin and colleagues [4,5], and a group of St Petersburg geophysicists led by V. G. Mavrichev [7], studied these issues for many years. The latter introduced the term “deposit-type anomaly” (ATZ), which we consider unfortunate, although it became fairly widespread. Local magnetic anomalies associated with sedimentary rocks altered by migrating hydrocarbons are now widely sought worldwide. The nature of secondary alteration remains under investigation; major advances are reviewed, for example, in the well-known paper by D. Schumacher [10].
Most geophysicists worldwide interpreting aeromagnetic data for hydrocarbon exploration use 2D technologies, restricting their analysis to profile (flight-line) data and assembling the results on a common plan. Abroad, the most popular technology is SRM/MBS, developed by R. Foote [9]. These abbreviations mean “Sedimentary Residual Magnetic” (SRM), referring to residual magnetic fields from sediments, and “Magnetic Bright Spot” (MBS), an allusion to the well-known seismic technique. Geoscience & Technology, the company implementing this 2D technology, describes its effectiveness as follows:
1. MBS anomalies occur over 56% of discovered fields;
2. 97% of identified MBS anomalies are associated with fields;
3. incorporating SRM/MBS more than doubles exploration effectiveness.
Russian geophysicists also use a 2D technology known as SPAN (spectral–spatial data analysis) to investigate local anomalies (ATZ).
The SIGMA-3D package enables three-dimensional analysis of these anomalies, further increasing the effectiveness of the exploration toolkit. One such capability, provided by DVOP, is interpretive tomography, from the Greek tomos—slice, part, layer—and grapho—I write, draw, depict. This is a system for studying geological structures through gravity or magnetic fields that provides layer-by-layer images [3]. Several approaches have emerged, proposed by different researchers, although not all explicitly identify their work as tomography. They can be divided into two groups: approximation and filtering. Both are implemented in SIGMA-3D.
using SIGMA-3D programs at oil fields in the Caspian region:
а) Oleynikovskoye field; б) Kaspiyskoye field.
Fig. 2 shows three-dimensional magnetization-distribution models obtained by interpretive tomography for the Oleynikovskoye and Kaspiyskoye oil fields in the northwestern Caspian region. The models are displayed as block diagrams with fragments of magnetization isosurfaces in altered rocks. At Oleynikovskoye, secondary alteration of sedimentary rocks by hydrocarbons locally increased magnetization, whereas at Kaspiyskoye it decreased magnetization. The nature of the changes is governed predominantly by the composition of the sedimentary rocks affected by hydrocarbons and can vary considerably [10].
To identify possible hydrocarbon migration pathways, specialized modelling of the anomalous magnetic field can be performed using a differential version of approximation-based interpretive tomography. The procedure sequentially fits the magnetic field with REIST to adjacent horizons spaced, for example, 1000 m apart, then synthesizes a volume model from differences between their magnetization distributions. Each calculated difference is assigned to the middle of the layer analysed. Fig. 3 illustrates results for an exploration area in Rostov Oblast as north–south and east–west vertical effective magnetization sections over the depth interval -1.5 km to -4.5 km. Anomalous zones resembling vertical migration pathways are clearly visible in the central part of the area within a northwest-trending zone.
Fig. 3. East–west (а) and north–south (б) effective magnetization sections through a three-dimensional model for an area in Rostov Oblast, obtained by differential approximation-based interpretive tomography: layer from -1.5 to -4.5 km; in the north–south sections, the top is on the left
Volume models derived from airborne geophysical data by interpretive tomography enable geologists to address relatively subtle problems. In the Caspian region, around the Karpinsky Ridge, analysis of three-dimensional density and magnetic-property models distinguished several compositional complexes within the folded Palaeozoic succession (Fig. 4). Specific lithological and stratigraphic assignments have not yet been possible because a priori drilling data are unavailable, but modelling has revealed their internal structure. They apparently form a stack of tectonic nappes dipping southward and rising northward. Different parts of the ridge contain 3–4 nappes, each a few kilometres thick. The outer margin of the nappe-and-fold structure inferred from airborne geophysical data closely matches its position inferred from drilling. These results also correlate with recent studies of the folded Palaeozoic from deep wells in the eastern Karpinsky Ridge, which penetrated stacked tectonic nappes separated by gently south-dipping thrust surfaces.
Notably, the tectonic nappes mapped by interpretive tomography overlie the southern flank of the Astrakhan Arch, together with its Devonian–Carboniferous sedimentary cover, for up to 70 km. These findings suggest the possible presence of subthrust gas and condensate accumulations south of Astrakhan, buried beneath nappes of folded Palaeozoic rocks. More detailed gravity, magnetic and seismic surveys appear necessary to refine the geometry of the thrust sole and the burial depth of potentially hydrocarbon-bearing strata.
| А | Б | В | |
| 1 | |||
| 2 |
Fig. 5. Results of principal-component filtering of gas-concentration data:
А—methane, Б—propane, В—radon; 1—first component, 2—second component.
Mapping faults in the sedimentary cover is an important task in oil and gas exploration. Clearly, neither a suitable structure nor evidence of hydrocarbon migration into it guarantees a deposit. If numerous faults can be traced within an identified structure, oil and gas have most likely not been preserved there.
This task is best addressed through lineament analysis of the residual magnetic-field structure, for example by principal-component filtering. If airborne gas or gamma-ray spectrometric data are available, however, the same technology can analyse gas-component distributions to address it. The rationale is as follows. It is generally accepted that radioactive radon is associated with deep sources and enters the atmosphere through weakened zones, primarily faults permeable to gas at the time of its formation. Volatile hydrocarbons—propane and methane—genetically associated with oil and gas accumulations should enter the atmosphere through the same pathways. Integrated lineament analysis may therefore, first, map the fault system in the sedimentary cover and, second, classify the identified faults as active, along which fluid supply may continue, or healed, along which this effect is absent. Fig. 5 shows principal-component filtering of airborne gas data together with the local radon component distribution. The filtering results for different gases are notably similar. Airborne gamma-ray spectrometric data can also detect halos of near-surface rock alteration caused by migrating hydrocarbons.
Incorporating detailed, high-precision gravity data into modelling can significantly improve interpretation of sedimentary-cover structure. The fairly conventional practice of modelling the cover using gravity and seismic data alone, without magnetic data, generally “sweeps” the effects of basement density heterogeneities into the sedimentary cover. The resulting cover-density model becomes so distorted that its calculated field strongly correlates with the magnetic field, whose main sources clearly lie in the basement. Adding magnetic surveying to the seismic–gravity suite avoids this practically inevitable and inappropriate “sweeping” and thus eliminates a typical geophysical error.
Thus, interpretation of modern airborne geophysical survey data can address diverse problems in petroleum geology and improve the overall effectiveness of the exploration toolkit.
REFERENCES
1. Andreev B. A., Klushin I. G. Geological Interpretation of Gravity Anomalies. Leningrad: Nedra. 1965. 495 pp.
2. Babayants P. S., Blokh Yu. I., Trusov A. A. Investigation of crystalline basement structure in platform regions using magnetic and gravity data. Geofizika. 2003. No. 6. pp. 55–58.
3. Babayants P. S., Blokh Yu. I., Trusov A. A. Interpretive tomography using gravity and magnetic data in the SIGMA-3D software package. Problems of Theory and Practice in Geological Interpretation of Gravity, Magnetic and Electrical Fields: Proceedings of the 31st Session of the D. G. Uspensky International Seminar. Moscow: OIFZ RAS. 2004. p. 11.
4. Berezkin V. M., Loshchakov A. M., Nikolaev M. I. Application of magnetic surveying to oil and gas exploration. Prikladnaya Geofizika. 1982. Issue 103. pp. 128–136.
5. Berezkin V. M., Budagov A. G., Filatov V. G. et al. Aeromagnetic surveying in the oil and gas exploration process. Geologiya Nefti i Gaza. 1993. No. 10. pp. 26–30.
6. Blokh Yu. I. Detection and Separation of Gravity and Magnetic Anomalies. Moscow: MGGA Publishing House. 1995. 80 pp.
7. Kulikov G. N., Mavrichev V. G. Aeromagnetic surveying for oil and gas. Geofizika. 1995. No. 2. pp. 37–42.
8. Donovan T.J., Forgey R.J., Roberts A.A. Aeromagnetic detection of diagenetic magnetite over oil fields // AAPG Bulletin. 1979. v. 63, p. 245–248.
9. Foote R.S. Relationship of near-surface magnetic anomalies to oil- and gas-producing areas // AAPG Memoir 66: Hydrocarbon migration and its nearsurface expression. 1996. p. 111-126.
10. Schumacher D. Hydrocarbon-induced alteration of soils and sediments // AAPG Memoir 66: Hydrocarbon migration and its nearsurface expression. 1996. p. 71–89.